Dyson self-service support

My brief was formed from insights gathered via feedback forms and analytics that showed the support section had low satisfaction and accomplishment rates for customers, thus driving calls to the contact centre and creating general dissatisfaction.
The brief was to conduct a holistic review of the users’ experience for both self-service support propositions and the purchase journeys of spares and tools via the support area. My objective was to increase customer accomplishment and satisfaction rates for the key self-service after-sales journeys, which were monitored through NPS, feedback forms and a reduction the number of calls to contact centre.
Within my role, I was responsible for creating the project plan and choosing the correct methodologies for the research and design. I worked alongside a BA, Product Owner and Project Manager, so I was the main practitioner on for executing the research and overseeing the project delivery. My team worked within the IT department, which was often in conflict with the primary owners of the global sites: the commercial team. Therefore i often had to work closely across both teams in order to move the project forward.
There were a number of other challenges to overcome for the project:
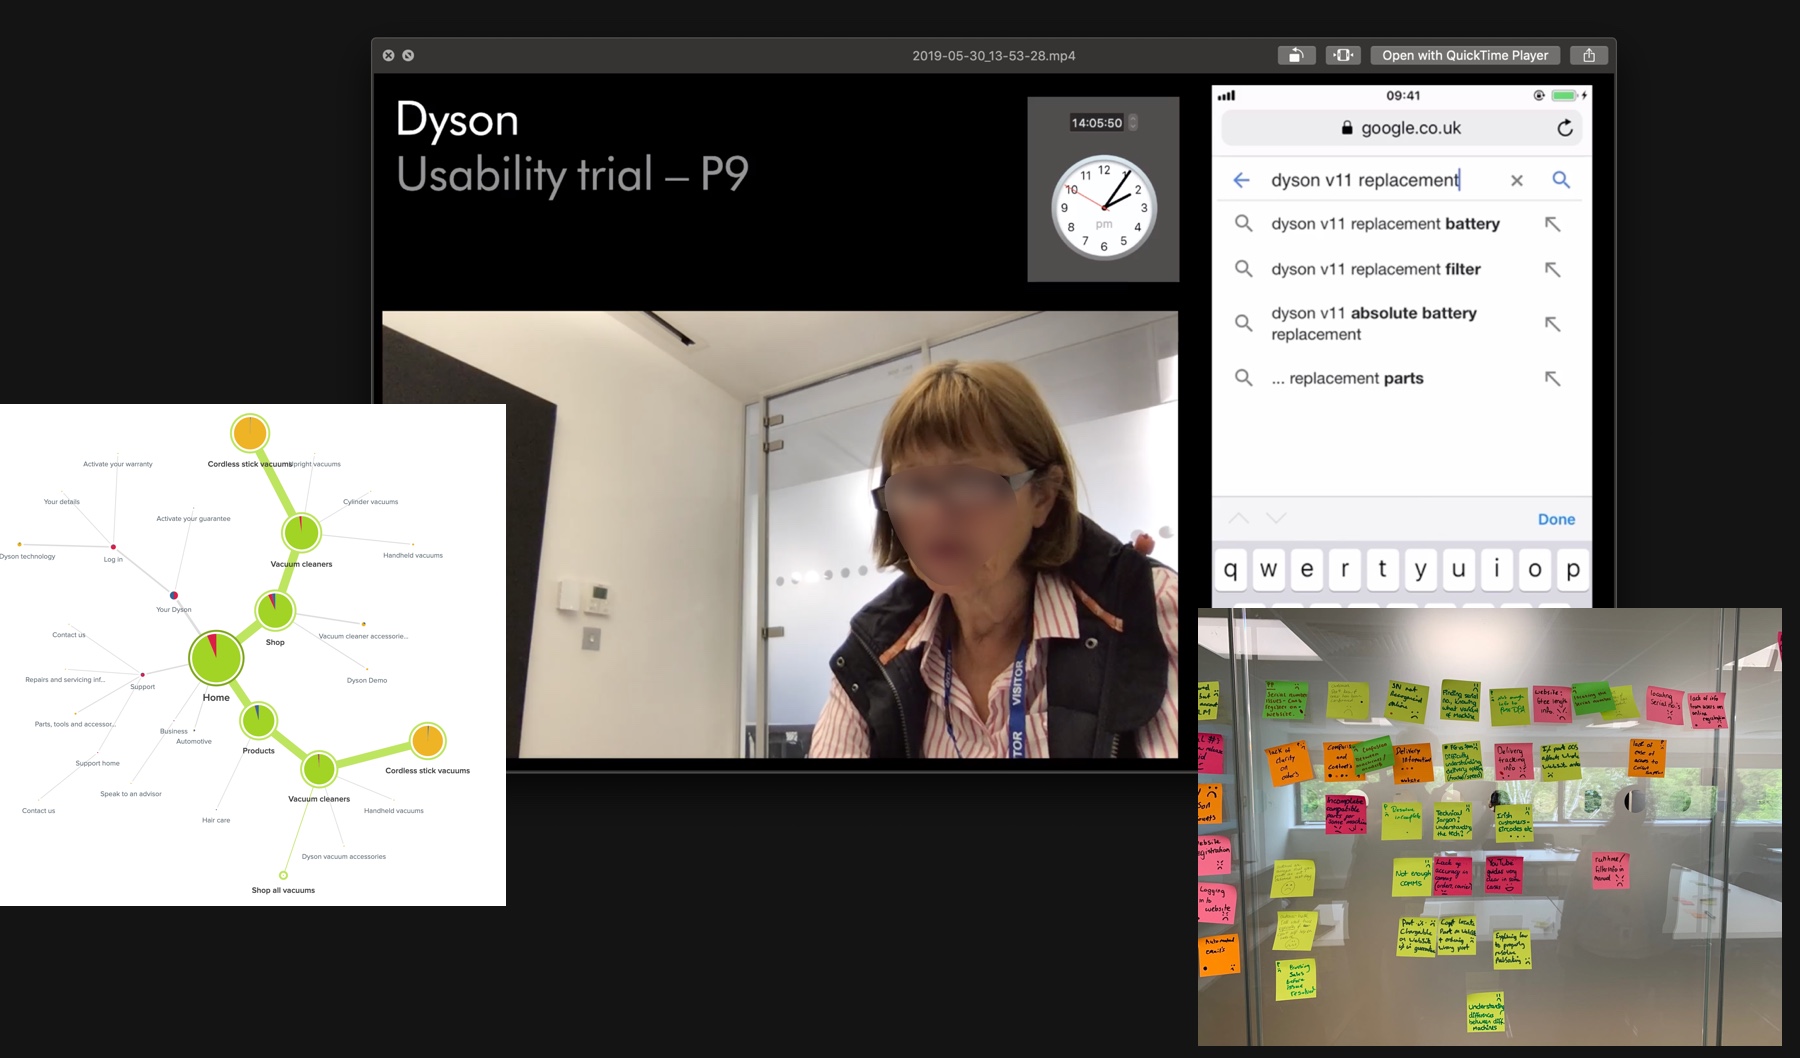
When I joined the project, some work had been started within the discovery phase, this focused largely on the GB market and aimed to benchmark and understand existing pain points and potential opportunities for improvements. The discovery phase included:
My involvement from here was to synthesise the desktop research completed and create a hypothesis from which to continue the research. It seemed clear that there was more research to be done on understanding the efficiency of the navigation within the support area, and the fortunately the global navigation & information architecture were being considered in a separate stream of work during this time, so i was able to work closely with the UX team on that stream of work to incorporate the necessary support tasks into tree-jack tests they were running.
The discovery outputs were divided into short and long term focuses of work.
The short term changes involved addressing pain-points that had been identified via the activities conducted. These were mostly changes that could be made within the CMS, to avoid the long lead times involved with development.
Long term outputs were changes that couldn’t be applied via the CMS, or that required further testing & investigation were then taken into a review of the structure. I divided these into three projects:
From the interviews, tree-tests and comparator research I had a good indication that the segmented structure of the support area wasn't suited to the users' typical behaviour when trying to self-serve. So my next steps were to try and understand whether a re-structure could increase fundability of content and increase satisfaction.
I conducted further usability testing sessions which achieved:

The sessions were run locally, in the UK and the findings were positive towards the new structure - all participants responded well to the alternative structure. There was a reduction in time spent locating content comparatively to the current structure as well as praise for usability. Note, for fairness, a prototype was created that showcased both structures in equal fidelity, participants were not made aware of which was the newer or older versions and the tasks were comparable.
The learnings from this research was well received within Dyson, however, we pushed for a wider set of participants to validate the structure with. So our next step was to test with participants in the US, Canada and Ireland across various devices. For this I used UserZoom’s unmoderated testing facility, as we weren’t able to travel abroad or hand the research over to teams in each market.
On reflection, this unmoderated testing was a poor choice of methodology for the project; the findings were far less insightful than anticipated and the time involved to review the testing videos was far greater than having remote interview sessions with participants. If we were to run similar sessions again in the future, I’d push for recruiting participants in each market and running remote interviews instead of unmoderated. The extra expense in recruitment & incentive fees are outweighed by the reduction in time spent trawling through 100s of useless videos and hunting for any insightful findings.

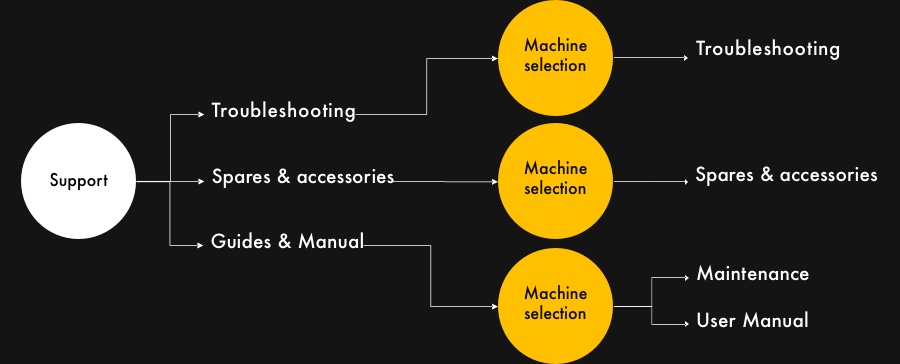
These sessions were broken up to include a card sorting session and a review of a prototype that portrayed a concept for the product first structure.
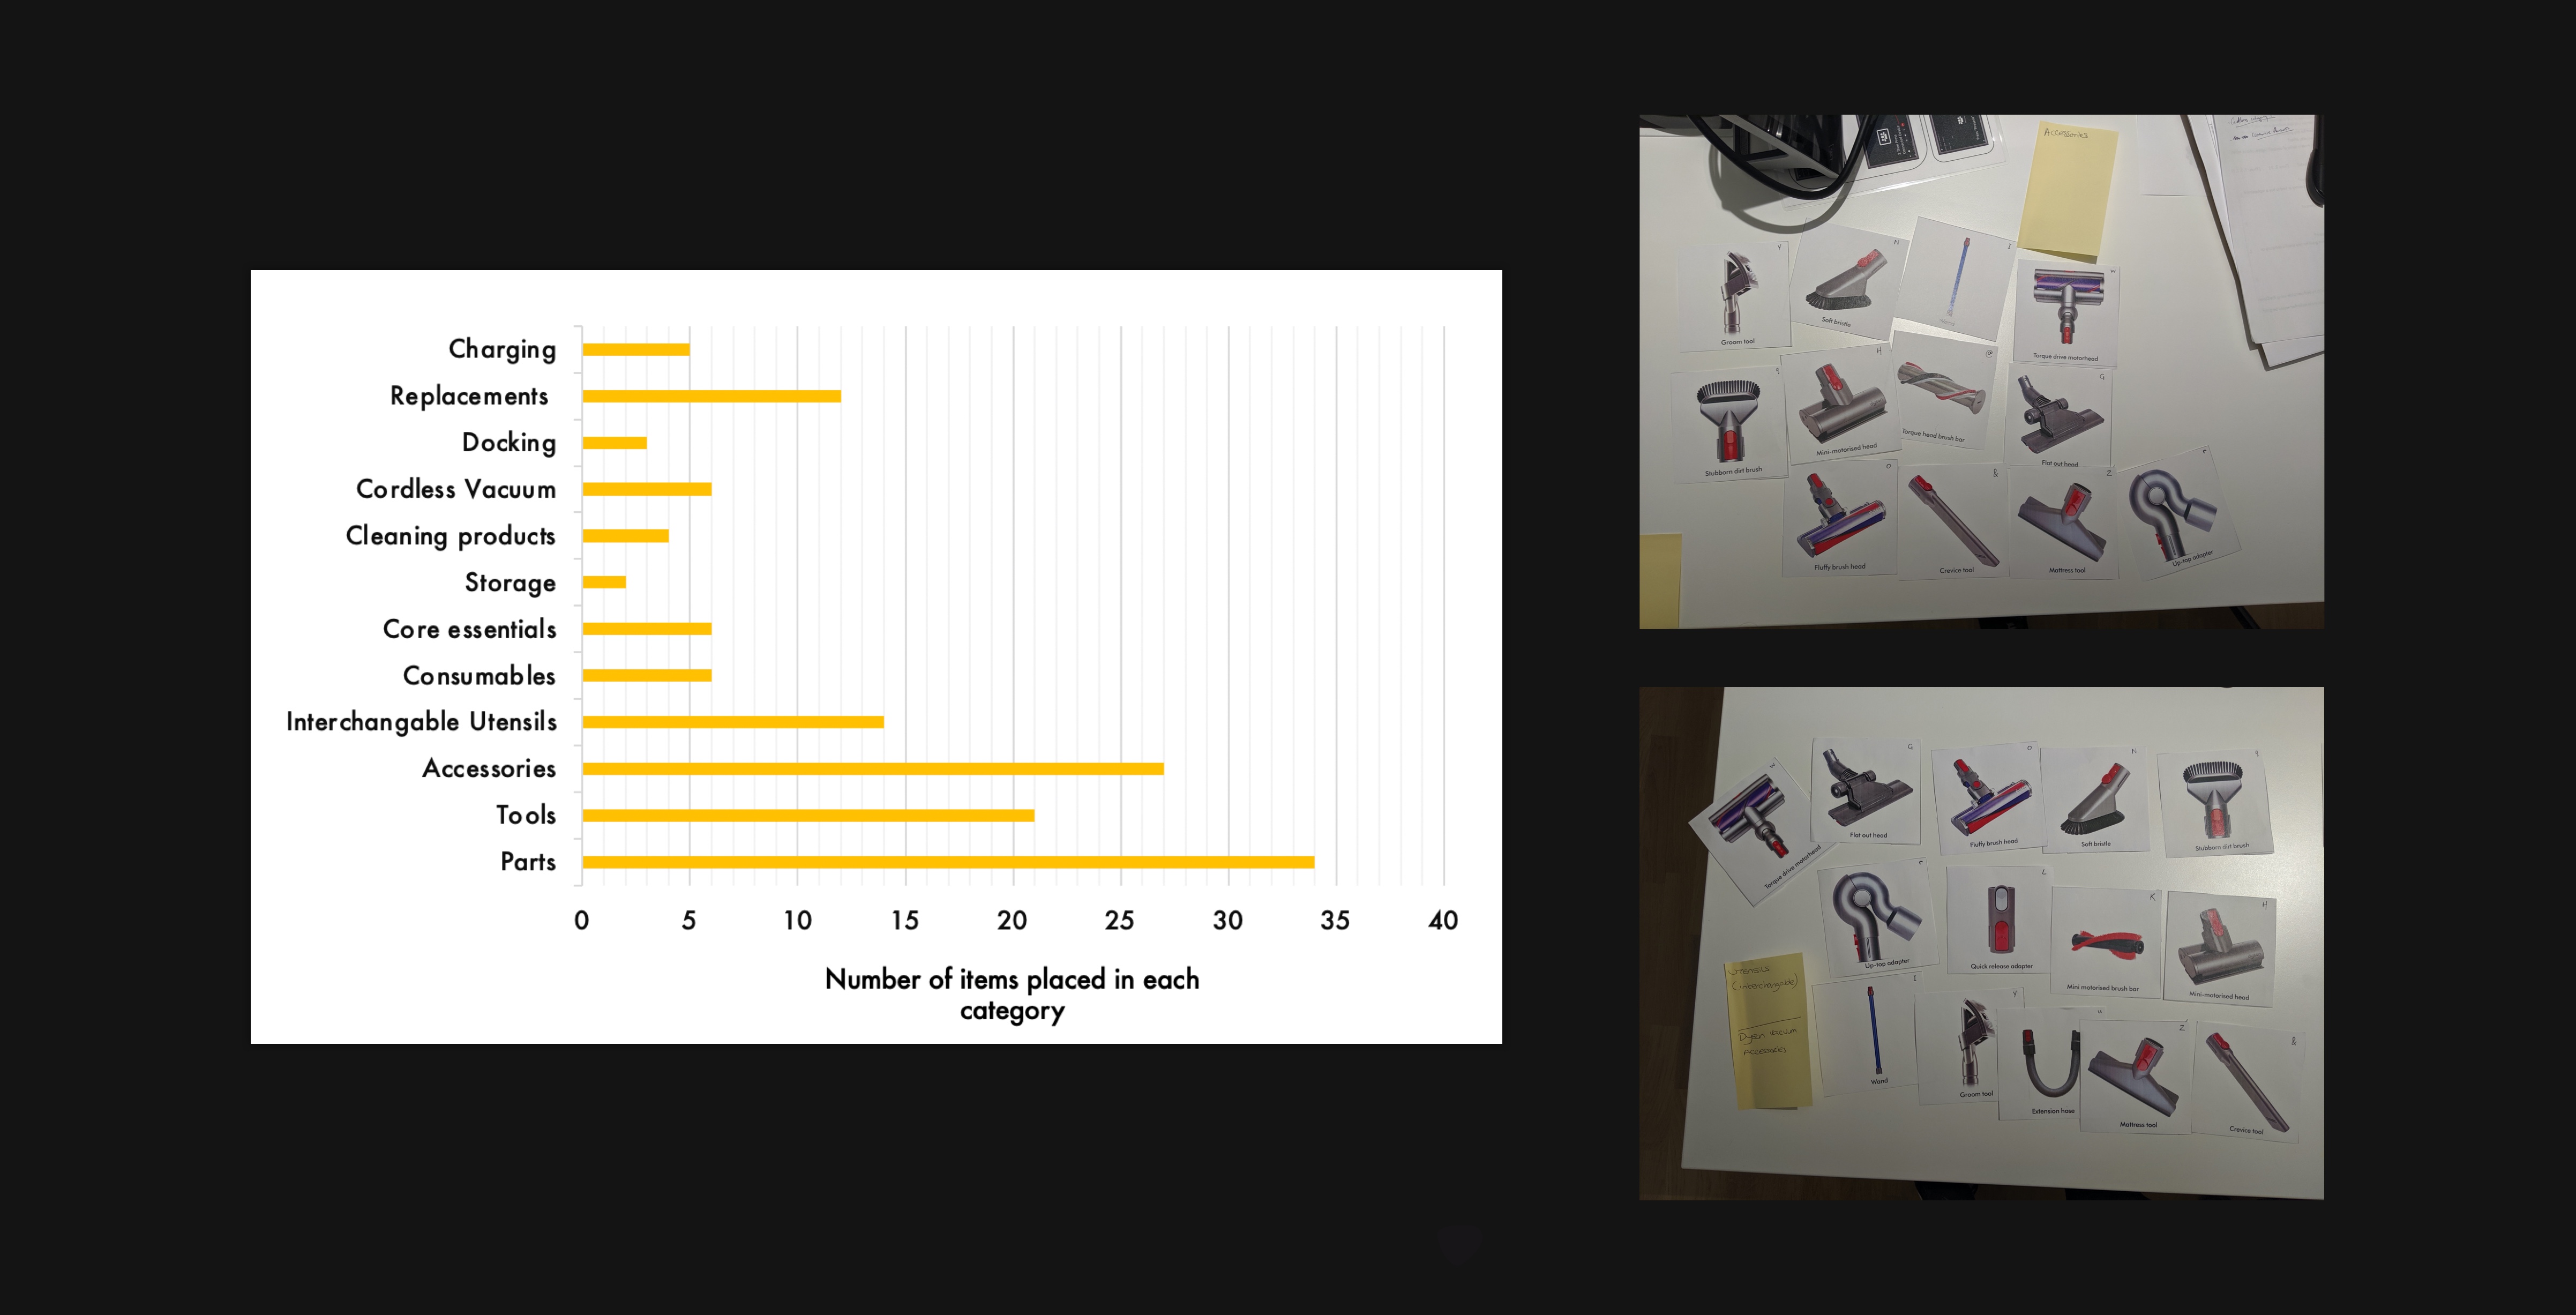
This was carried out by using 30 printed out cards that showed an image of a spare part or tool for a popular vacuum. Participants were asked to group these together in collections that made sense to them. Participants were then asked to describe each group of items, which led to fairly ambiguous labels that were highly contextual to their own ideals. So, the participants were asked to think whether they would re-name these labels if they were to describe this category to a friend. This gave the participants the chance to think of the label in both a personal, and a universally understandable way.
With the structure validated, we then went onto migrating and updating the content, which involved:
Final deliverables:
The new support area was updated and delivered in late 2020, within the first 3 months we discovered that:
Previously, in a worst case scenario, a user would have to choose between 60 variants.A worst case scenario in my new structure, a user would have to choose between 13 options, clearly defined by colour not SKU name (80% fewer choices)

